The atmospheric players responsible for this coastal storm are a cut-off low that has been aimlessly spinning around in the Southwest US for a few days that is likely to finally get a move on its eastward trek and meet up with a broader trough digging down from Canada. As discussed in previous posts, mid-latitude cyclones (i.e. non-tropical storms) get most of their strength from air above the surface. The surface low and the wind pattern around the system provide a feedback mechanism that allows the storm to get stronger, as long as the upper-level energy is still there. The weather models had (and still have as of Sunday morning) some discrepancies of when and where the two key players will be and if there will be a significant storm.
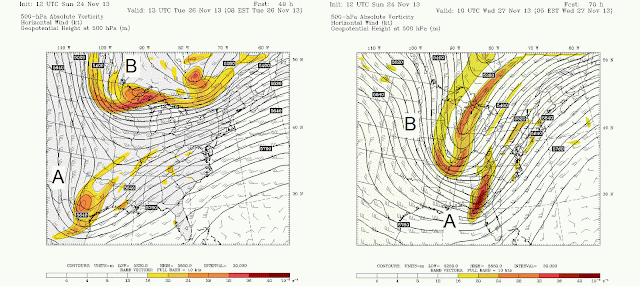
The Stony Brook University Weather Research and Forecasting (SBU-WRF) model run, while only one possible solution of what may happen, is used here to discuss the event. Looking above the surface at 500 mb or about 2 miles up, the image below shows the two key players, a vorticity maximum associated with a cutoff low moving eastward in the South (A) and the vorticity maximum associated with a trough digging southward from Canada (B). Vorticity is a measure of the spin or rotation of the air. If air at upper-levels acquires a spin it can have the effect on air below it of drawing it upwards if the spin is positive (i.e. cyclonic or counterclockwise in the Northern Hemisphere). If the two features meet near the coast then a stronger coastal low may form than would have formed from the systems independently.
 |
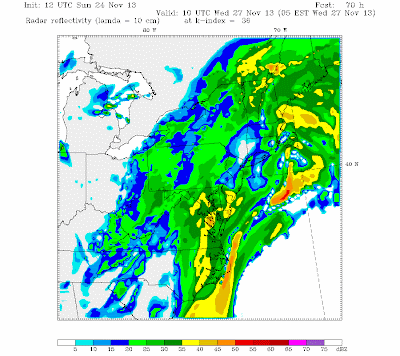
| Simulated Reflectivity for 5 AM EST on Wednesday. |
Let's focus our attention closer to the surface. What can we expect from this coastal system? According to our SBU-WRF simulation, there should be periods of heavy rains Tuesday-Wednesday. The image on the right shows simulated reflectivity, or what you'd expect to see if you looked at a radar image around that time. The pockets of heavier showers are indicated by the yellows, oranges, and reds. The snapshot provided is for 5 AM EST on Wednesday meaning that that broader area of precipitation north and east of LI will have already moved through on Tuesday.
 |
| 925 mb Temperatures for 5 AM EST on Wednesday. |
A warranted question for this event is whether that precipitation should fall as rain or snow. If we look at 925 mb temperatures, which is a little bit above the surface, LI and other coastal regions remain well above freezing for the majority of the heaviest precipitation. As the system moves to the northeast, there may be some snow showers when that colder air that is to the west moves in.
One final issue with this storm is the presence of high winds. The 925 mb image shows wind barbs at this level which indicate wind speed. The triangles symbolize 50 kts (~ 58 mph) and the longer straight line is 10 kts (~12 mph). Just south of Long Island is a wind barb showing 3 long lines, so 30 kts which is roughly 37 mph. Those winds could reach the surface if the precipitation is heavy enough, but it is likely that the strongest winds will remain off the coast of Montauk for the majority of the event. As the system intensifies, there is a chance that windy conditions can persist throughout Thanksgiving Day but at least the precipitation should have moved through by Wednesday night.
We looked at one model run of one single model to deduce this forecast. However, models are run generally about 4 times a day and there are over 5 main weather models. Each model run at each time has its own solution. For a predictable event, there isn't much difference between each time a single model is run or between different models. However, this event had started out pretty unpredictable and thus there were widely varying solutions, such as the storm occurring on Thanksgiving and LI receiving a lot of snow. To illustrate the variability, forecasters look at "spaghetti plots" which show a solution from different models for a certain atmospheric parameter. The image below shows 500 mb heights, so the green lines would show the position of that Canadian trough, or "B" in the above images. Notice how there seems to be some variability in how deep that trough is (how far it stretches southward) and even its position farther east or west.
 |
| GEFS Ensemble Solutions for 500 mb heights at 1 PM EST on Wednesday. (Source: Kyle MacRitchie) |
As time gets closer to the event and the initial atmospheric conditions that are input into the model are actually observed then the models all continue to converge on a solution. The NAM, GFS and Euro models are the main models looked at by forecasters and they are all starting to converge on a solution of a wet and windy Tuesday-Wednesday but a cool and dry Thanksgiving. Safe travels and Happy Thanksgiving!
Useful Links
- For more information about synoptic meteorology please visit The NWS Jetstream Site.
- For the latest in-house model run please visit the SBU-WRF site.
- For more spaghetti please visit Kyle MacRitchie's site.


No comments:
Post a Comment