Monday, July 1, 2013

Mission #9: Surprise Strong Storms Strike Early!

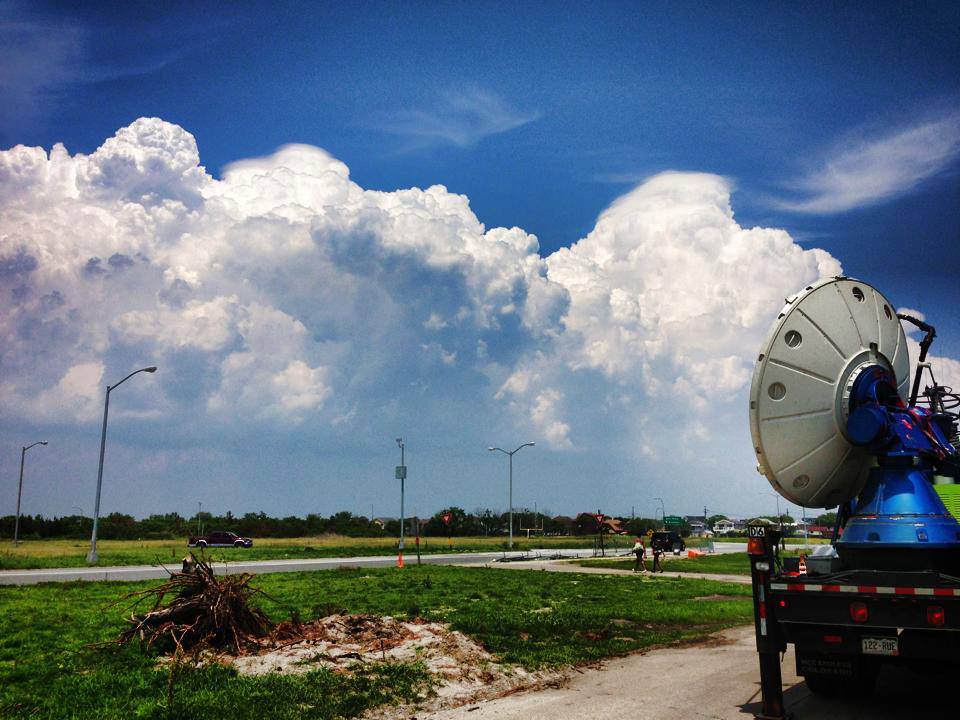
The DREAMS Project started off the month of July with a mission. Mission #9 took place on July 1st and a lot earlier in the day then the organizers had anticipated. Strong-to-severe thunderstorms developed early in the morning and propagated northeastward over Long Island and Connecticut. Thanks to the quick action of the DOW team (especially Rachel Humphrey who's been driving the DOW and teaching us how to operate it) the radar was set up in time for the action at Cedar Beach in Mount Sinai. A strong cell passed just to our north and some strong showers developed and moved overhead. After everything cleared up we were in a parking lot with a few inches of water to navigate around!

Weather Prediction Center's 12Z (8 AM) surface analysis.
The forecast for Monday, July 1st was very similar to the previous day's forecast. Most of the ingredients for strong storms were there such as tons of moisture as evident by dew point temperatures in the 70's F and some instability that would increase if there was solar heating during the day. Another ingredient that hasn't been mentioned is called wind shear. A thunderstorm develops from rising air that grows depending on the available moisture, instability, and lifting mechanism. That rising air is concentrated into a narrow swath called an updraft. Wind shear is defined as the change in wind speed or wind direction with height. If there is no wind shear than the updraft is perfectly vertical and when the air rises and condenses its water vapor to form clouds that rain, the rain can actually "choke" the updraft by flooding it with cold, descending air. Wind shear is important to tilt the updraft so that it isn't vertical so that the storm can persist for a longer period of time before dissipating. For Monday, the lifting mechanism was predominantly a stationary front that was situated just east of the Appalachians for most of the day. The forecast was for thunderstorms to develop later in the afternoon when the daytime heating of the surface from the sun would be at a maximum and therefore the amount of instability (CAPE) would also be at a maximum. However, what actually happened was strong thunderstorms got going during the overnight hours and because of the strong wind shear (strong winds from the south near the surface and stronger winds from the southwest higher up) and the added forcing of the stationary front, they organized into a strong line of storms. The original plan for Mission #9 was to catch some late afternoon thunderstorms, but after the National Weather Service issued a tornado warning for Union County in New Jersey around 9 AM (1300 UTC), the DOW team sprang into action.

DOW scanning to our northwest.
Pod in front of approaching storms.
The DOW left Stony Brook University around 10:30 AM and headed to our favorite location on the North Shore- Cedar Beach in Mount Sinai. The plan was that if the line of storms held together as it swept across Long Island, then we'd have the perfect view to our north over the Long Island Sound. We started scanning the skies by 11:30 and watched the line approach our location from the west-northwest. We deployed the pod to measure conditions near the surface throughout our deployment. An interesting feature that we measured with the radar was a possible updraft core. We took vertical slices through the cells as they approached us and saw a narrow area extending up into the storm of velocity values that were opposite of the storm motion. By 1:00 PM a shelf cloud was visible just to our north associated with a strong cell. A shelf cloud forms when there is air rising just ahead of the cooler air gusting outward from a thunderstorm.
 
Shelf cloud over the Long Island Sound (photo by David Stark).

After the strong storm passed to our north and east, we noticed there were a few smaller cells developing to our southwest. We positioned the DOW to take vertical slices of them as they grew and organized into a flash-flood inducing line of storms that passed overhead between 1:15 PM and 3:00 PM. The photo on the right is of the reflectivity data (top screen) and velocity data (bottom screen) that is showing a vertical slice through the second line of heavy rain. The yellows in the reflectivity data show a core of high value of dBZ (the unit of reflectivity) just about to approach the DOW. The velocity data shows mostly blues and purples which meant that all of those rain and cloud drops were moving towards the DOW (i.e. inbound). The students in the DOW had front row seats for the downpours that occurred and could see them approaching using the radar. Despite a leaky roof in the DOW, most of the participants in today's mission were able to keep dry! After the mission wrapped up at around 3:00 PM, water had pooled in the Cedar Beach parking lot to a depth of over four inches in spots! Dr. Kelly Lombardo's car is pictured below sitting in one such puddle. The DOW had to be backed out of a puddle to allow for its occupants to jump down to dry land.

Dr. Kelly Lombardo's car and the DOW sit in a few inches of post-storm water.

Despite having planned on an afternoon/evening mission, the DREAMS Project participants made a great effort to get the DOW out and into position to sample the surprise convection that maintained itself across the Tri-State area. Although we could not have measured the confirmed tornado (with any sites that we have legal permits for), that particular storm jump-started our day. We used that storm to decide that the convection was strong and would hold together as it traveled eastward closer to Stony Brook University. We recorded some great data of the passing convection before it cleared up for the rest of the evening. Therefore, Mission #9 was a success!

- For more information on shelf clouds, please visit this site: http://eo.ucar.edu/webweather/cloudpic1.html
- For more information on thunderstorm ingredients, please visit this site: http://spotterguides.us/advanced/advanced03.htm

Mission #8: A Quick Trip to the South Shore

The DREAMS Project celebrated the end of the month of June by having Mission #8 on Sunday, June 30th. The forecast was for scattered thunderstorms and the impromptu decision was made Sunday morning to try our luck at Smith Point beach in Mastic Beach. The students spent a couple hours with the DOW before wrapping up the quick mission. During that time they were able to scan two areas of weak, scattered storms. Something is better than nothing according to our optimistic sides!

The DOW left Stony Brook University around 2:00 PM and was set up to start scanning by 3:00 PM. There had been some fog at Smith Point but it had lifted a bit upon our arrival. The students were first able to sample some showers and thunderstorms to our northwest. After identifying the area of higher reflectivity with the horizontal scan, they chose to do vertical slices to see the semi-3D structure of the cells.


The DOW at Smith Point ready to start sampling nearby showers and thunderstorms.

Have you noticed that most posted photos of the DOW have the truck on what appear to be stilts? The DOW6 is equipped with 5 hydraulic feet that can have varying heights to make the DOW level on uneven surfaces. Why is this important? With a radar beam of energy coming and going from one point and moving in a circle and even up and down, there's a lot of math involved (especially trig)! To simplify the calculations, the DOW is leveled in reference to the ground that it is sitting on. This also ensures that the radar beam isn't being transmitted at really odd angles and completely missing storms. For the quality of the data, it makes sense to have it level if the DOW is going to be in one place. However, the data is perfectly fine if the radar is operated while the DOW is in motion. We haven't had much storm activity to actually need to operate the radar while in motion, unfortunately!

The level DOW using its hydraulic feet at Smith Point.

By around 4:00 PM an interesting single cell had fired up over the open ocean and was moving north-northeast. The students' attention thus focused onto this cell and they changed the orientation of the radar to take vertical slices of the cell instead of the activity to the northwest. Over the course of a couple hours, the cell grew and became more stratiform (i.e. a broader area of lighter rain versus convective which is heavier showers over a smaller area) before going out of range of the DOW. Interestingly enough, a group of very small-scale cells developed to the southwest of the original cell likely due to the fact that the original cell may have produced some outflow of cooler, denser air that forced air to rise above it. That may be how the cells were activated. At around 6:00 PM the mist began to thicken and cover anything exposed with water droplets. The students luckily all fit inside the DOW and paid attention to the developing fine-scale cells before wrapping up the mission at 7:30 PM. Despite being a quick mission, the students were able to become more comfortable operating the radar and with making decisions about where to selectively perform RHI, or vertical, scans through a particular area of higher reflectivity.

- For an inside look at how the different components of the DOW, please see this operations manual: http://somas.stonybrook.edu/downloads/DOW6OperationsManual.pdf
- For a near real-time update on where we'll be next, please see the DREAMS Project website: http://dreamsproject.weebly.com/schedule.html

Sunday, June 30, 2013

Mission #7: Scattered Convection Over Connecticut

The DREAMS Project completed another mission out in the field on Friday, June 28, 2013. Their goal was to study scattered convection (i.e. thunderstorms) that was, yet again, forecast to develop throughout the daytime hours and into the evening. The targeted location was Cedar Beach in Mount Sinai that had a clear view over the Long Island Sound into Connecticut. The students were able to measure the scattered thunderstorms that developed, gain an appreciation for the low-level marine boundary layer and possibly measure the smoke and debris from a fireworks show. A combination of interesting things being picked up by the DOW and incredible public interest kept the DOW at the beach for just under 12 hours! We had thought we were going to be kicked out of the parking lot at one point, but the Public Safety Officers were just very curious about our project.

The forecast for Friday was very similar to the forecast for Thursday regarding the uncertainty of where and when the scattered convection, or thunderstorms, would develop and how far they would travel. The ingredients (moisture, instability, and lift) looked to be most promising in Connecticut. There was a lingering convergence boundary situated there that could likely provide the lifting necessary to fire up the storms. The decision was made to target afternoon convection with Cedar Beach as the chosen location because of its great view to the north and northwest. The DOW left Stony Brook University at 12:15 PM and the pod and radar were set up by 1:30 PM. By that time there were already large, developing cumulus over CT that the DOW was able to scan. The reflectivity data showed that the clouds extended very high and were filled with large droplets and the velocity data showed that the storms were moving away from the radar towards the northeast. 

DOW at Cedar Beach in Mount Sinai for Mission #7.
 
SBU Student Danny C. manning the DOW.
Students set the DOW to take PPI scans, or horizontal scans (PPI stands for Plan Position Indicator), and then once they determined where a storm was they set the DOW to take RHI scans, or vertical slices (RHI stands for Radar Height Indicator). By doing that, they were able to really dissect a particular storm.

Long Island had two of the ingredients for convection (lots of moisture and a fair amount of instability or CAPE) but it was missing the lifting mechanism. Wind was blowing from the south for most of the day so the air was very moist. There were a lot of cumulus clouds that were thin and shallow, or near to the ground, that were forming due to the existence of a moist marine boundary layer, or air close to the surface that can freely rise without much help from any other atmospheric lifting mechanism (like a front). Throughout the day storms were developing over NJ that moved, very slowly, to the northeast that we were eventually able to measure.


Anvil overhead during sunset.
Mammatus observed at Cedar Beach.
The first part of the storm over NJ that came to us was the anvil cloud. The anvil cloud forms when air that is carrying a lot of moisture rises into the developing storm and reaches a level where it faces resistance to rising any more so it instead spreads out horizontally. The anvil usually spreads out downwind of the storm, which is why we could see it so far east when the storm was so far to our west. There was an interesting feature on the underside of the anvil cloud that we saw when we looked up at around 6:00 PM. It is called mammatus and it looks like the cloud has bubbles, or udders from its literal Latin translation. When there is mammatus, it means that at the level of the cloud there is a lot of unstable motion of air. That means that the temperature and moisture of the air in the cloud is not as resistant to upward and downward movement so it moves up and down to give the strange bubbling appearance.

A lot of people wanted to check out the DOW.
There was a lot of public interest in the DOW while we were parked at Cedar Beach. We really do encourage everyone to not be shy and come and ask us what we are doing! Part of the DREAMS Project is to perform public outreach by educating and sparking an interest in weather and the really interesting tool that is visiting Long Island to study it. Long Islanders know that they experience really unique and interesting weather, so all the more reason to come and say hello when you see us! Because of the large amount of interested people asking questions and the active weather to our west, we remained at Cedar Beach until about 11 PM. In doing so, we were able to see a fireworks display to our north over CT. After the display finished, some students claimed to have been able to measure some of the smoke that was created from the festive explosions because there was an area of higher reflectivity values near that location. Even though we have the 4th of July marked as a “down day” aka a day off, now we are kind of curious what the Macy’s fireworks display in NYC would look like measured with the DOW!

After a very long day of sampling some storms, the DREAMS Project members felt very satisfied because despite not having any strong storms nearby, the curiosity of the public and the eagerness of all of the students to stay out late was invigorating. Hopefully we'll catch some strong storms or a great Long Island Sea Breeze case one of these days before the DOW leaves town, but at least we are all enjoying our experience!


DOW at Cedar Beach after a long day of scanning.

For more information about mammatus clouds, please see the following websites:
- http://eo.ucar.edu/webweather/cloudpic9.html
- http://earthobservatory.nasa.gov/blogs/earthmatters/2013/05/24/mammatus-clouds-over-oklahoma/

Friday, June 28, 2013

Mission #6: The MCV That Took Too Long!

The DREAMS Project mission for Thursday, June 27th was contingent upon hoping that convection developed out ahead of a larger-scale thunderstorm system called a mesoscale convective vortex or MCV. The actual MCV was forecast to move across Long Island close to midnight. Students and faculty agreed that the environment was good enough to warrant a trip to Jones Beach to try to catch some storms.

12Z (8 AM) OKX Sounding.
The forecast for Thursday showed plenty of moisture throughout most of the lower atmosphere, instability that became enhanced with the diurnal, or daily, high temperatures, and a possible lifting mechanism produced by an upper-level shortwave that was helping to maintain a mesoscale convective system. Most of the ingredients for strong to severe convection were there and the Storm Prediction Center (SPC) placed most of the Mid-Atlantic region under a slight risk for severe weather over a day in advance. The model data and atmospheric observations were assessed early in the morning before the decision to deploy the DOW to Jones Beach was made. The morning's 12Z (8 AM) sounding from Upton, NY (OKX) showed a very moist atmosphere up to nearly 600 mb or nearly 16,500 ft above the ground. Assuming that the surface temperature would warm up during the day, then there would be a fair amount of instability (as measured by CAPE) to allow for storms to develop and grow. The CAPE was forecast to be highest over Northwestern Long Island and most of New Jersey. The idea was that the DOW would be stationed at Jones Beach with a clear view of storms that may travel to the south and north, depending on where they formed. With that plan, Mission #6 was a go!

The DOW left Stony Brook University around 11:30 AM and made its way to Jones Beach. This wasn't an easy feat because at 13.5 feet tall, the DOW can't simply take the Google Maps-suggested route with the low bridges on the parkways. As soon as the DOW arrived at the West End of Jones Beach, there were already some developing cumuli right along the sea breeze boundary near the Queens/Nassau border. This is almost exactly what was observed and scanned with the DOW on Monday! Because there was a lot of instability and moisture, the cooler and denser air that was flowing from the ocean acted like a boost to the air near the surface that caused it to rise and form clouds. The DOW reflectivity data showed the small cells producing rain, but nothing more severe like hail. The DOW velocity data showed the cells moving away from our location, or off to the northeast over the Long Island Sound.

The developing cells that greeted the DOW at Jones Beach for Mission #6.


The Tornado Watch issued by SPC ahead of the MCV.
The students out in the field on this mission were excited to see the real-time data that the DOW was producing. The tough thing about the small cells was that they were moving away from us and weren't going to last forever. The MCV was still centered in Pennsylvania and was hours away from arriving near Long Island. By 2 PM, however, the SPC issued a tornado watch for most of New Jersey. They were concerned about all of the ingredients for severe storms being present out ahead of the MCV, just as we had noted. We decided to wait at Jones Beach to see if any storms developed over southern NJ and got caught up in the mean southerly flow. Although the DOW is a Doppler On Wheels, those wheels don't have legal permission to go anywhere so we do have to deal with some element of waiting for the storms to come to us. We kept an eye on the analysis of the environment according to near real-time model output and saw that CAPE values over NJ were really high (> 3000 J/kg) but not too many storms were developing. This was likely because there wasn't much of a lifting mechanism or a way to get the air to rise from the surface vigorously enough to form clouds and storms. We waited until almost 7 PM to wrap up the mission with nothing much but clutter being measured by the DOW. We did witness the low-level moisture flux from the ocean with the strong southerly winds bringing visible, thin low-level clouds over the land.

The MCV was still rotating and causing flooding over western NJ by the time some of the team and the DOW returned to Stony Brook University. There were no reported tornadoes by this time either. At around 9 PM the decision to not have a night mission to catch the MCV was made. This decision was based on the fact that, at that time, the thunderstorm cells associated with the MCV were weakening and the line that was expected to pivot across Long Island was actually thinning and breaking apart. The mesoscale models also provided some support for that decision. Unfortunately, although that line of storms did weaken immensely, they released to the east a lot of low-level cooler air caused by the evaporation of raindrops near the surface which is known as an outflow boundary. The outflow boundary acted to organize a fresh line of storms that did in fact cross Long Island from 10-11 PM. Oh well, the DOW needed to get some rest after about 7 hours of scanning! Mission #6 was still a valuable mission that collected data on convection along the Long Island Sea Breeze. We didn't get to measure the MCV simply because it took too long and we want to be awake and eager for our next mission, of course!

- For the exact definition of a mesoscale convective vortex, please visit this site: https://www2.ucar.edu/news/backgrounders/thunderstorm-glossary#mcv
- For the near real-time data that we use to make some decisions out in the field, please visit this site: http://www.spc.noaa.gov/exper/mesoanalysis/new/viewsector.php?sector=16

Wednesday, June 26, 2013

Mission #5: Scattered Convection From the North Shore

The DREAMS Project had a down day on Tuesday, June 25 after the exciting mission of the previous day. During the afternoon, Dr. Colle held a weather briefing that connected students and the National Weather Service's Science Operations Officer Jeffrey Tongue to discuss the forecast for Wednesday, June 26 and to make a plan for a mission.

Now there is one thing that is widely known among meteorologists, young and old-- the hardest season to forecast precipitation for is the Summer. Why, you ask? Well, the precipitation tends to form from small-scale thunderstorms. While there are preferential locations where these storms form such as over higher terrain or near converging river valleys, they still may depend on small-scale atmospheric variables that are harder to predict. Also, while a storm may be wreaking havoc in Nassau, the Hamptons are likely staying quite dry and sunny. Weather models have a lot of trouble predicting small-scale, thunderstorms. A whole type of model made specifically for looking at small-scale storms is called a mesoscale model. Recall that DREAMS stands for Doppler Radar for Education and Mesoscale Studies. There's that word again! When making the forecast for Wednesday, June 26, we began by looking at the larger-scale model output to get an idea of what the big picture was and if there would be any key players such as a front or low pressure system. Unfortunately, there was no larger forcing that could give us an idea of what time or how strong any storms would be. Therefore, we had to rely on some mesoscale models. It's important to not just look at one, because each model has something slightly different about it whether it is how it calculates the physics of raindrops or the motions of air right near the surface. There's never one model that always "wins" which is why it helps to remain as unbiased as possible and keep an open mind. Here's some information about some models that we looked at. The North American Model (NAM) has a 4-km horizontal resolution (that's roughly 2.5 miles) that is operationally run by the government. It showed some weak storms moving through the area in the late afternoon. The Coastal Meteorology and Atmospheric Prediction Group at the School of Marine and Atmospheric Sciences at Stony Brook University (SBU) actually runs their own mesoscale model called the Weather Research and Forecasting (WRF) model. You could run it, too, if you had a Linux machine with very good processors! The SBU WRF is run twice-daily and generates images to a webpage. The webmaster/graduate student Matthew Sienkiewicz will gladly take suggestions about new types of plots if you happen to have any (see his site in the comments at the end of the post). It also has 4-km horizontal resolution but because of the nature of the model setup, it provides a slightly different picture. The SBU WRF had some storms moving across Long Island during the evening hours.

Because there was uncertainty regarding the timing and location of any convection, the decision about where and when to go was put off until the morning, when fresh model output would be available and the atmosphere settled down from the night before. However, even in the morning there was a large amount of uncertainty. The decision was made to stay close to home and to set up the DOW at Cedar Beach in Mount Sinai with a view looking north over the Long Island Sound. The DOW left SBU at 3 PM and headed east.

The pod in place at Cedar Beach.
Students set up the pod to take surface measurements right near the water and set the DOW to scan horizontally. Now when it comes to field work, especially when there's uncertainty involved, there can be a little bit of waiting. The students waiting patiently and answered any questions that curious onlookers (which are encouraged!) had about the strange truck on their turf. Everyone kept updating the radar app on their phones, paying close attention to some cells that had fired up over Connecticut. If they formed a line and moved east-southeastward then they would sweep right over the Long Island Sound and provide great data about storm behavior over the cool waters. Unfortunately, around 7:30 PM the line of storms had dissipated into mainly stratiform rain and Mission #5 was called off. Luckily we were very close to home and have better hopes for the next couple days. The atmospheric ingredients for widespread activity look to be better for tomorrow because of an upper-level shortwave, or trough of lower pressure, can provide some ascent or a lifting mechanism. We took a chance with the DOW for Mission #5, albeit a conservative one by staying close to SBU. Hopefully the next mission will provide more data. Stay tuned!

- For weather model data, please visit this site: http://mag.ncep.noaa.gov/ (or many others, like twisterdata.com)
- For the SBU WRF model plots, please visit this site: http://dendrite.somas.stonybrook.edu/LI_WRF/index.html

Mission #4: Scattered Convection Near NYC

The DREAMS Project started its second week with a mission, to keep the DOW busy of course! The forecast for Monday, June 24 called for a slight chance of scattered severe thunderstorms in the New York City vicinity and an enhancement of the New York Bight Jet. Thunderstorms sound exciting but you may ask, "What exactly is the New York Bight Jet?" The New York Bight Jet is an interesting coastal phenomenon that involves low-level winds, as the word "jet" implies. When there is synoptic (or large-scale) southwesterly winds, the winds near the surface just east off the coast of New Jersey can become enhanced south of Long Island. The winds become enhanced because of processes that are similar to a large-scale sea breeze (see the previous post for more about sea breezes), or simply stemming from the idea that the land is heated a lot more than the adjacent ocean water. The DOW team of students and faculty set out to Rockaway, NY to set up at Jacob Riis Beach to catch all the action. Although the NY Bight Jet was not measured with the DOW to be as strong, or enhanced, as it was forecast to be, the team stationed at Jacob Riis Beach successfully captured some convection that fired up along the smaller-scale Long Island sea breeze. They happened to be in the right place at the right time.

The region was placed under a "slight risk" for severe weather by the Storm Prediction Center for that day. Conditions were ripe for convection. The 12Z (8 AM) sounding from the NWS NYC Office showed that
12Z (8 AM) Upton, NY Sounding for June 24.
although there was a near-surface inversion (temperatures rising with height which causes resistance to the rapid rising of air), the gradual warming of the surface temperature due to solar insolation should allow for the values of CAPE (Convective Available Potential Energy, from the post for Mission #1, remember?) to increase and allow for the development of convection. Recall from that post on the embedded convection of Mission #1 that in order to have thunderstorms you need three ingredients: moisture, instability, and lift. From the morning's sounding, there was plenty of moisture throughout the low to mid-levels of the atmosphere, but what about lift?


Snapshot at 18Z (2 PM) of the near-surface convergence.
The Long Island sea breeze ended up providing the necessary lifting mechanism for the storms to fire up. When the westerly flow converged with the southerly flow near the Queens/Nassau border, thunderstorms formed and a severe thunderstorm warning was even issued by the NWS around 1:30 PM EDT. Because the DOW was situated at Jacob Riis Beach, they could watch the storms from a safe distance and collect horizontal and vertical slices of radar reflectivity and velocity.


A photo of the storms from Jacob Riis Beach taken by a member of the DOW field group.
 The New York Bight Jet was measured to have formed after the excitement of the early-afternoon convection wore off. Therefore, Mission #4 was a success and provided a great dataset of the Bight Jet and convection over Western Long Island. After driving the DOW about 2 hours away from Stony Brook University, I think it is safe to say that it was well worth the trip. If you missed the DOW's visit to Rockaway on Monday, June 24, you may see us again soon! It's a great location with a great "view" that we hope to use again. 
 

Monday, June 24, 2013

Missions #2 & #3: The Quiet Version of the Long Island Sea Breeze

A sea breeze occurs when the solar radiation from the sun heats up the land a lot more than a nearby body of water due to water's high heat capacity, or resistance to absorbing heat quickly. The air near the ground heats up, becomes less dense and thus rises. Because there can't be a vacuum, air rushes in to take its place, which happens to be the cooler, more dense air from above the sea. This circulation doesn't always stay confined to the shore and can infact move inland. The Long Island Sea Breeze can sweep cool air from the Atlantic Ocean across the entire island and may even meet and converge with a Long Island Sound Breeze coming in from the north.

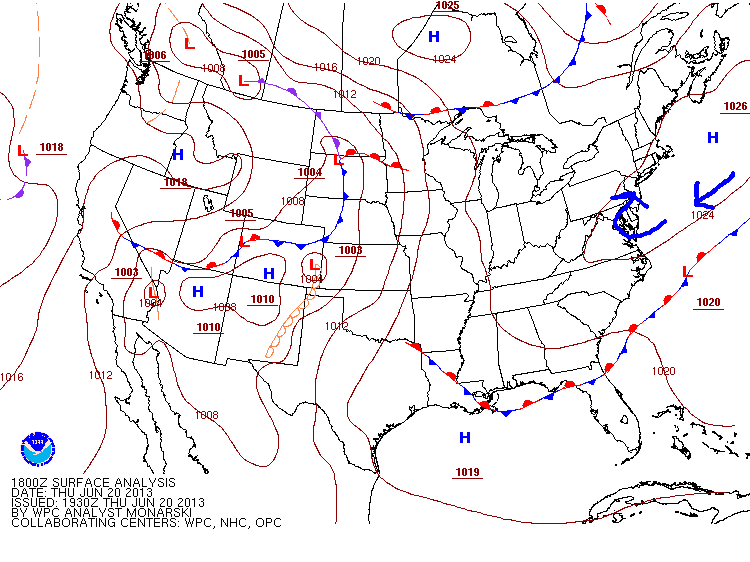
Missions #2 and #3 of the DREAMS Project focused on measuring the environment of the sea breeze. Weak west-southwesterly winds  from a high pressure system to our northeast set up a favorable pattern for sea breeze development on both June 20th and 21st. A description of both missions is provided.
18Z (2 PM) surface analysis from the Weather Prediction Center showing a high pressure system to our northeast with anticyclonic (clockwise) flow around it.

Mission #2: Sea Breeze Interception
The pod that was deployed.
The goal of the mission on Thursday, June 20th was to capture the full evolution of the sea breeze as it made its way from the South Shore to the North Shore. The plan was to station the DOW at a point along the South Shore and measure the boundary until it went "out of sight" at which time the DOW would be re-positioned to a more northern location. Students would take surface measurements with hand-held instruments to try to keep tabs on its movement. William Floyd Parkway provided the perfect north-south route for this mission. The students and the DOW arrived at Smith Point Beach in Mastic Beach at 9 AM. A pod was deployed at dune-level to take surface measurements of the onshore flow. Students worked with the DOW to measure the boundary that indicated the northward advancement of the sea breeze by looking at reflectivity and velocity data.

Map showing locations of students and the DOW.

A car of students was sent northward along William Floyd Parkway with hand-held instruments to fill-in some data-sparse regions that were lacking surface observations and also to look for surface-based evidence that there was a boundary. They measured temperature, dew point, relative humidity, wind speed (averaged and maximum gust), and wind direction. There were two extra soundings launched from the National Weather Service (NWS) Forecast Office at Upton. One at around 15Z (11 AM) and one around (18Z) 2 PM. A faculty member, John Mak, from the School of Marine and Atmospheric Sciences at SBU flew his research aircraft in the afternoon right over Smith Point that took measurements of the environment including temperature, relative humidity, pressure, 3-dimensional winds. He completed spirals to procure a vertical profile of these quantities at Smith Point and Brookhaven Airport and flew transects through the boundary layer from over the ocean towards land. I don't think John was measured by the DOW, but that would be interesting!

At around 1 PM, the DOW relocated to Enterprise Park at Calverton (EPCAL) where it set up near the north entrance. There were plenty of cumulus in the sky showing where the convergence of the low-level winds along the sea breeze were causing rising motion. There was no measurable rain associated with these clouds, so this was a very quiet sea breeze event. Not as quiet as Mission #3 as you'll soon discover.

DOW on Nicolls Rd.
Mission #3: Sea Breeze Part II
Not wanting to waste a day with the DOW in town, the forecast for Friday, June 21st showed the possibility of another sea breeze development. The decision was to station the DOW at one location and let the sea breeze come to it. That location was chosen to be at EPCAL so that the data can be compared with that of the previous day. The DOW left Stony Brook University at 9:15 AM and headed east to EPCAL. It set up at the North Entrance and students prepared the pod to take surface measurements and took their own measurements with hand-held instruments to compare. A team of students left the site to travel south along William Floyd (in a car marked with "sea breeze interceptor" in paint on the window!) to take surface measurements and look for signs of the boundary.

By 1 PM EDT, the students were getting excited over the slightest tiny developing cumulus cloud. There were not a lot of clouds along this boundary even though the data being collected by the DOW showed a clear wind shift and higher reflectivity values.
The DOW with a tiny cumulus.
There was clearly enough "stuff" in the atmosphere to scatter back radiation to the DOW to be measured but not enough moisture to produce clouds for our naked eyes to see. For the sake of comparison, a team of students launched an extra weather balloon at the NWS and John Mak flew his aircraft to take measurements of the environment. The obvious question is that even though both of these sea breeze boundaries were "quiet", why was one so much "quieter" than the other? If one looks at each day's 12Z (8 AM) soundings, the environment looks very similar.

12Z soundings for June 20 (left) and 21 (right).
The data collected have not started to be analyzed yet, but the short answer is a difference in low-level moisture between the two days. The air near the surface is converging and rising, so the nature of that air will determine if there will be developing clouds (among other things). The air near the surface on the drier day (June 21st/Mission #3) has a lower dew point and a higher surface temperature. Another factor is that the air aloft is drier too which can be told by the distance between the red temperature line and the green dew point line.

No storms fired up along the sea breeze boundaries because there was a large area of high pressure dominating the region and causing the atmosphere to be stable, or resistant, to upward vertical motion. The sea breezes, although they were measured and are very interesting, were a bit on the weak side. This is the nature of field work, however, so it is important for the students to experience first-hand how the atmosphere doesn't always provide exactly what you are looking to measure. Hopefully the missions completed during the second week with the DOW are a lot more exciting! Stay tuned!

- For more information on sea breezes, please visit this site: http://www.srh.noaa.gov/jetstream/ocean/seabreezes.htm
- For near-realtime updates on the DREAMS Project, please visit this site: http://dreamsproject.weebly.com/schedule.html

Friday, June 21, 2013

Mission #1: Embedded Convection Within Stratiform Precipitation

The first day out in the field with the Doppler on Wheels (DOW) was a wet one for the students and faculty involved. Tuesday, June 18th was Mission #1 and  the second day of the field campaign. The forecast was for precipitation to form somewhere along a frontal boundary to the north of the Island and somewhere to the west of the Island. The weather models discussed during the planning meeting the previous day were in pretty good agreement that there should be some form of precipitation for the DOW to measure. The question was where would it be? The decision was made to station the DOW at Jones Beach where it would have the ability to scan south and west, and even to the north if needed.

The students partitioned into a few teams. There were students stationed with the DOW at Jones Beach where they quality-controlled the data as it came in and adjusted where the radar was scanning if an interesting feature developed. There were students given hand-held instruments to take down observations of the environment that included temperature, dew point, relative humidity, wind speed (max gust and averaged) and wind direction at the DOW site and along Jones Beach. The project also included extra radiosonde, or weather balloon, launches from the NWS NYC Forecast Office in Upton, NY to provide a vertical profile of atmospheric conditions in-between times when the NWS launches their own balloons at 8 AM EDT and 8 PM EDT. There were even a couple students remaining at Stony Brook University with real-time observations including regional radar, satellite, and high-resolution model data to act as real-time forecasters (i.e "nowcasters") should they be needed.

The18Z (2 PM) radiosonde.
The students stationed with the DOW got to scan embedded convection within stratiform precipitation, as the title of this post states. That means that there was a broad area of light rain developing west and south of Long Island and within that light rain, there were smaller cells of heavier rain. The students got to take some vertical slices of these embedded cells with the DOW and analyze reflectivity and velocity data. The students not in the cabin of the DOW got a little wet once the rain moved into Jones Beach, but that's part of the fun of field work! The radiosonde group successfully launched one balloon at 18Z (2 PM EDT) which showed that the environment was moist from middle to upper-levels and the wind profile was veering, indicating that they were south of a warm frontal boundary (see plot).
The Nowcasters were never needed thanks to the availability of smart phones and the great data being measured by the DOW!

You may ask, "Why weren't there more thunderstorms? Isn't that sort of boring?" There weren't that many thunderstorms (the data showed very infrequent measured lightning strikes) because in order for storms to form you need three things: moisture, instability, and lift. There was plenty of moisture in the atmosphere as the morning's sounding and extra 2 PM sounding both showed. Another way of knowing where there is moisture is to look at satellite imagery and see where there are clouds. The lift was provided by the convergence boundary. This means that along central NJ and points west there were low-level westerly (from the west) winds colliding with low-level southeasterly (from the southeast) winds. When low-level winds collide, there is rising motion and therefore air can be lifted. The missing ingredient was the instability or the idea that if you have a bubble of air, if it is lighter (hotter) than the surrounding air then it will rise and it will keep rising until its temperature is equal to that of the surrounding air. A measure of instability is Convective Available Potential Energy (CAPE) and is the go-to quantity for forecasting instability for convection. On the day of Mission #1 there was marginal CAPE that didn't impress any of the student or faculty forecasters at the planning meeting. This was likely due to the abundant moisture that was allowing for clouds persist and block out most of the sun. This kept the sun from having its energy reach the ground to warm it up and raise the temperature so that air bubbles near the ground would want to rise. Despite the lack of instability, there was plenty of moisture and lift that the students got to see and measure first-hand which was certainly far from boring.

If you didn't get a chance to see the DOW at Jones Beach, don't worry! We'll likely be back if there's a chance for storms to fire up to our southwest. The first day out in the field was a success with an interesting and complex weather system. Hopefully there will be some more classic thunderstorms while the DOW is still in town-- so please keep your fingers crossed!