The weather on Long Island has been typical for Fall; one day you need a winter coat and the next day you are tempted to throw on shorts. This is due to the steady eastward progression of storm systems from the clashing of air masses across the country. This active pattern shows that the atmosphere has a lot of energy to dispel. Recently, attention has been focused to where the weather systems have been a lot more destructive and impacted so many unfortunate people that were caught in their paths.
Super Typhoon Haiyan: A Meteorological Perspective
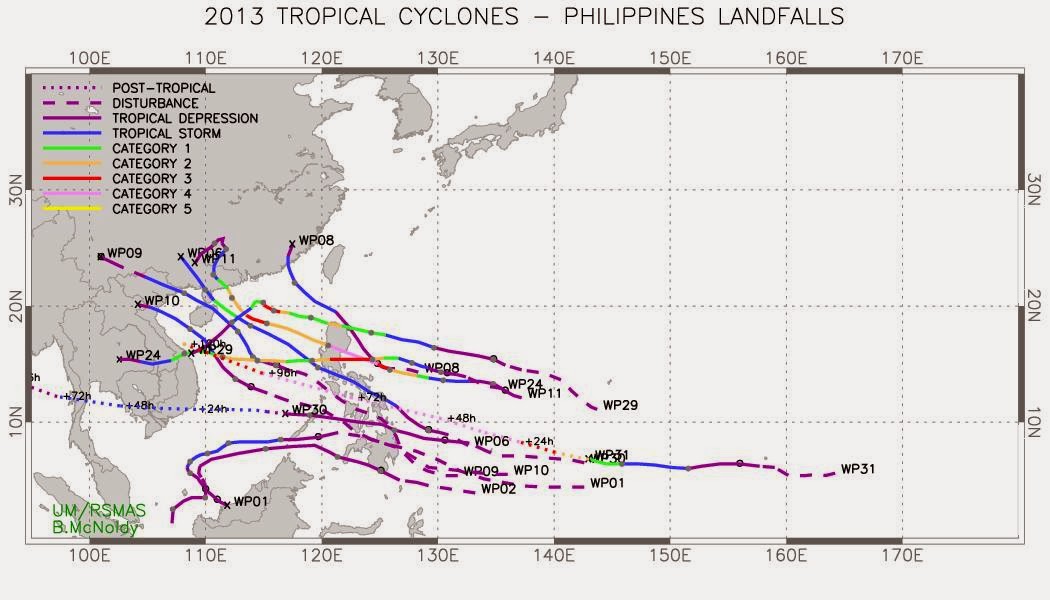
Super Typhoon Haiyan, or Yolanda as it was locally known, wreaked havoc in the Philippines before
tracking towards extreme northern Vietnam and Southern China. Tropical systems form from a preexisting disturbance, or cluster of thunderstorms. Unlike the low pressure systems that we are used to during this time of year that get their energy from the air at upper-levels, tropical systems grow from the bottom-up. The heat and moisture from a warm ocean surface is what allows for tropical systems to grow to the highly-organized devastating systems that they can be. The heat from the ocean is brought towards the center which causes the center to be warmer than the outside environment. Therefore there is lower surface pressure in the center because warmer air is less dense or less heavy than colder air. Once a surface low pressure center is acquired, the storms can rapidly intensify and acquire much more of a spin as winds travel cyclonically towards the center (which is counter-clockwise in the Northern Hemisphere). Another difference between the non-tropical cyclones that we are used to in the fall season and tropical systems is that non-tropical cyclones need to have their low pressure center titling sideways with height otherwise air can fill it in and essentially kill it. The reverse is true for tropical cyclones that require a completely vertical core to survive. Think of a chimney, for example. If you close the flue then all of that smokey air comes right into your home instead of exiting and that smokey air is not healthy for survival, just like cold and dry air is not healthy for a tropical system's survival. In the atmosphere, the wind speed and direction varying with height is called wind shear, or just shear. In order for a tropical cyclone to remain upright there needs to be very little shear.
The three greatest risks to life and property associated with tropical cyclones are high winds, a lot of rain and storm surge. Long Islanders are no stranger to storm surge from last year's Hurricane Sandy impacts. Storm surge occurs when a storm travels over open water and as you've seen when you blow on the surface of your cup of coffee, water piles up downwind. When a storm is moving in a certain direction, the water piles up in the quadrant that lines up with the way the winds are blowing. In the case of Haiyan, that was its northwest quadrant (or upper-left). The geography of the Philippines made the storm surge even more impactful because water was channeled between islands of the archipelago and the relatively flat terrain allowed the water to reach far inland.
Typhoon Haiyan formed from a small cluster of thunderstorms and fed themselves the energy from the warm waters of the West Pacific Ocean. The system acquired rotation and was able to intensify to the highest possible classification of typhoon (Super Typhoon is similar to our Category 5 Hurricane in the Atlantic Ocean Basin). The typhoon formed over
waters near or exceeding 30 C (86 F) around November 6th and tracked westward in an environment with
very low shear (< 10 m/s) which allowed it to form a nearly
perfectly symmetrical eye and central dense overcast (CDO)
region of clouds around the time of its estimated peak intensity before its first
landfall. This landfall devastated the city of Tacloban on November 8th with high winds, driving rain and a sudden and powerful storm surge estimated at greater than 15 feet with 30-foot waves estimated from satellite measurements. The landfall and associated precipitation can be seen from
this radar loop.
Lightning was found to be very prominent in the eyewall of Super Typhoon Haiyan which provides some insight into the ferocity with which winds were rising and taking a variety of raindrops and even ice very high above the storm that had a different electric charge what was within the nearby clouds.
Typhoon Haiyan left the Philippines and then made a northwestward move to extreme northern Vietnam. This was due to the steering flow in place, or the fact that a broad region of high pressure around which winds flow anticyclonically (clockwise in the Northern Hemisphere) so that once Haiyan got on its western edge, it was steered more towards the north (from 6 to 10 o'clock, for example). Although it weakened a little bit, it maintained typhoon status because the waters of the South China Sea were a very warm 26-29 C (78-85 F) and there was still very weak wind shear allowing it to keep its vertical structure in the moist environment of the region.
Super Typhoon Haiyan: A Historical Perspective
The Philippines unfortunately, like most Caribbean nations, lie right in a prominent tropical storm track. It's not unusual for them to make landfall and fortunately the strongest super typhoons do tend to stay out to sea and only affect mariners.
Prior to Haiyan's formation, several tropical cyclones had already crossed the Philippines this year with the more recent storm's associated rainfall causing the soil to be saturated and mudslides imminent.
There was some discussion among the media that falsely claimed
that this storm was the strongest tropical cyclone in history
which isn't true.
As of now there are no ground-based observations of wind speed to provide any information about the storm's actual intensity. In the Atlantic, we rely on aircraft observations of wind speed for official observational purposes that also help make the computer models of the storms more accurate. Unfortunately, there aren't usually aircraft flown into typhoons in that region of the Northwest Pacific so all of the wind speeds had been estimated from
satellite imagery with what is known as the Dvorak technique. The Dvorak technique uses satellite imagery of structure,
cloud top temperature and other quantities to estimate the strength of a
tropical system where there is no actual observational data within the storm. Super
Typhoon Haiyan did reach the highest level of 8 on the Dvorak Intensity Scale,
but a lack of ground-based measurements will mean that it is unlikely
that the strongest winds produced by Haiyan were measured and
reported.
The rainfall from Super Typhoon Haiyan wasn't anomalously high for tropical systems traversing the Philippines, but unfortunately many tropical systems were tracking right across the archipelago in recent weeks. A tropical storm had just crossed a few days prior to Haiyan making landfall which caused a combined accumulation of about
two feet of rain in ten days. Haiyan had slightly stronger rainfall rates as compared to that tropical storm, but only by about a
half of an inch per hour. All rainfall measurements were derived from the TRMM satellite again due to the lack of ground-based measurements. (
Source: NASA)
This storm was incredibly powerful and our thoughts are with all of those affected. If you haven't already please consider donating to the relief efforts via organizations such as the
Red Cross.
For more information about tropical cyclones please visit:
Tropical Cyclone Introduction (NOAA/NWS)
For more information about Typhoon Haiyan please visit the following sites:
-
University of Wisconsin-Madison CIMMS Satellite Blog
-
NASA's Haiyan Blog Entry
Closer to Home: Tornado Outbreak of November 17, 2013
Switching gears to a discussion about a much more recent event and one that struck a lot closer to home, today there was a fatal tornado outbreak in the Ohio Valley. A strong continental cyclone with a surface pressure at the center below 990 mb after 00 UTC on November 17th or after 7 PM local time moved from the Midwest towards the east throughout the day on Saturday and Sunday. Out ahead of its cold front, warm moist air moved northward and filled the Great Plains with that air mass that is very conducive for fueling thunderstorms.
As
previous posts have discussed, for severe and especially tornadic storms the following ingredients are needed: moisture, instability and lift. The moisture is necessary because if dry air is lifted, clouds will not form. Instability is needed because the air being lifted needs to be able to lift itself very quickly which usually means it's warmer than the air surrounding it (think of a hot air balloon). The lifting mechanism can be the cold, dense air of an approaching cold front or if there is enough moisture and instability, a slight push from the cooler air from a neighboring thunderstorm may be enough to send the air rising violently. Another important ingredient is shear (just like as discussed regarding larger systems above). A thunderstorm that forms in an environment with a large amount of directional shear can actually have air horizontally rotating near the surface that is then bent upright by the storm's updraft that can then exhibit the same rotation and spawn tornadoes.
The models had predicted the environmental conditions conducive for a widespread severe weather outbreak in the Ohio Valley for Sunday, November 17th. The conditions verified by looking at the surface observations that morning as well as the
weather balloon observations that showed plenty of moisture, sufficient low-level directional wind shear (winds from the south at the surface but trending to be more from the west with height), and the potential for instability as the sun warmed the surface throughout the mid-morning hours. The Storm Prediction Center issued a spine-tingling "Particularly Dangerous Situation" statement which they reserve for tacking onto watches that are highly probable and likely to be highly destructive to life and property. Two such PDS watches were issued today (
#1 and
#2). The SPC can't issue warnings as that is up to the local National Weather Service Weather Forecast Office.
 |
| Storm Reports as of 11 PM EST from NOAA/SPC. |
As of 11 PM EST there have been reports of 81 tornadoes as well as over 400 reports of damage due to high winds estimated to be greater than 73 mph (65 kt). The news outlets are reporting 5 fatalities attributed to the outbreak. Hopefully that number won't increase and is likely a lot lower than it could have been without the skilled forecasting expertise exhibited with this weather event.
A question I have heard some people raise is whether or not this is normal for November. I'd argue that it is normal for November. The ingredients are all there and
on average there are about 50 tornadoes per year in the month of November. If the total count of tornadoes is verified to be around 80 than it may be in the top 5 of November outbreaks from data from 1950-2010 (
SPC).
This system must continue its eastward trek and with it comes the possibility for severe weather for our area. Long Island and the Tri-State area may face some damaging wind gusts before the cold frontal passage and during it. Out ahead of the front there is a strong low-level jet, or a core of strong winds, that can actually be mixed down to the surface through the development of turbulent eddies. Think of waves crashing on the shore-- the air crashes with the ground which can send some air spiraling upwards (like waves splashing upwards) and consequently air must come downwards to fill the void and if that air exhibits a higher wind speed then that is brought to the surface as a wind gust. Another term for this is mechanical turbulence. Air with higher wind speeds can also be literally dragged down to the surface by heavy precipitation and the cold, dense air rapidly rushing downward because it is negatively buoyant (think of a failing hot air balloon!). The turbulent eddies caused by the temperature difference of air near the surface versus the faster-moving air above the surface is known is thermal turbulence.
The cold frontal passage is forecast to be somewhere between 4-7 AM EST.
Our department's own operational model has it passing through starting at 3 AM and finally moving east of Montauk at 7 AM. Expect heavy rains and those gusty winds that were previously discussed.
 |
| Simulated Radar Imagery from the SBU-WRF for 5 AM on November 18th. |
For more information about thunderstorms please visit this
NWS Jetstream Page.